Part two
About two weeks ago I made a start with describing an industry from a doughnut perspective. The approach we use when discussing an industry is to take it from the perspective of the value chain, including usage. When we discuss the apparel industry for example that picture would look something like this:
I started my description, arbitrarily, with use and focussed on the volume of clothes bought each year. I used some statistics for one particular country, but since the industry is a global industry, I will now use more global data. Over the last 20 years, for example, there has been a twofold increase in the amount of clothing produced, despite a global population increase of 28%. With every item of clothing we buy we are contributing to the detrimental effects of apparel production, unless we buy second hand.
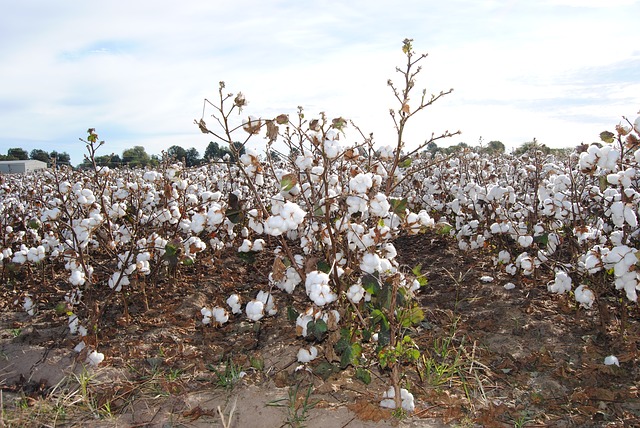
Cotton, for example, is a very pesticide-intensive crop. It is grown on 2.5% of the world’s agricultural land but consumes 16% of all the insecticides and 7% of all herbicides used worldwide – that’s more than any other crop in the world. Cotton receives about 3.7% of fertilizer applied worldwide. Runoff fertilizer is known to cause eutrophication in coastal waters and estuaries.
Five countries make up around 75% of global cotton production:
| India | 6.1 million tons |
| China | 5.5 million tons |
| US | 4.1 million tons |
| Brazil | 1.9 million tons |
| Pakistan | 1.7 million tons |
In total, 27 million tons of cotton are produced a year. Cotton is not only used in apparel or underwear, but also in textiles like bed linen, towels, table cloths and the like. But to give you an idea of this amount: it would translate to 27 t-shirts per person per year.
Natural fibres, including cotton, make up 29% of total fibre for apparel production. The largest share of 63% is synthetic fibre production. .
To put the table above in another light, I looked up some data about water usage in m3/kg cotton fabric produced:
| Blue water m3/kg | Green water m3/kg | |
| India | 5,230 | 15,837 |
| China | 1,849 | 3,059 |
| US | 1,401 | 4,070 |
| Brazil | 112 | 6,263 |
| Pakistan | 9,388 | 2,563 |
These numbers are the result of a water footprint assessment of cotton. Green water refers to the uptake of groundwater and blue water refers to irrigation water. Irrigation water is pumped from groundwater elsewhere or from open surface water like rivers or lakes. An example of this is the irrigation of cotton fields from the Aral Sea.
This water usage is often referred to as virtual water usage, because it is used in the production of the t-shirt you bought, although often not in the country you live in – unless you live in one of the countries that produce cotton, cotton fibre or cotton fabric. Therefore virtual water is water usage unseen.
Note that there is a huge difference in water usage. This has to do with differences in climate. Cotton is in itself a flexible crop that can grow almost anywhere, but when the circumstances are not optimal, the yield is much lower. This means that the origin of the cotton used in a t-shirt matters, but you do not know this, since the only information you are provided with, at best, is the location of the manufacturer.
This picture shows the impact of consumption of cotton products by the people in the EU on the world’s water resources (Mm3/year). Period: 1997–2001:
A picture like this gives a whole new meaning to international trade.
When I focus on ecological cycles in my posts or otherwise, I am often encountered with incomprehension: what does the water cycle have to do with economics, interesting as it may be.
Well, “most of India’s water-rich crops such as cereals and cotton are grown in the dry states of Punjab, Uttar Pradesh and Haryana, which have very high evaporation rates, unlike wet states such as Bihar, Jharkhand and Orissa. This perverse situation greatly exacerbates India’s water problems and is largely the result of government policies” (The Guardian). In my opinion, this has inefficiency written all over it. A bad allocation of our resources. And, again in my opinion, this touches at the heart of economics. And this is but one example. When you study any ecological cycle you will find examples of inefficiencies. For this reason alone, I believe ecological cycles should be included in a 21st century economics education.
The water footprint numbers I used are exclusive of so-called ‘grey’ water or diluted water, often diluted with chemicals used further on in the production process. I am going to leave that for another time.
As you can see from the list of sources, I had to search every nook and cranny of the internet to gather the data I was looking for. The data I have used is consequently not all from the same year. I hope this improves in the future either because more and more recent data come available or our access to such data improves, for example through a university library. If anyone could help us with access to databases and journals that are in general behind a high paywall, that would be even more appreciated than a cup of coffee!
henny@21steconomics.org – You can also find me on LinkedIn
Sources:
Age and active life of clothing – PLATE. Retrieved from https://www.plateconference.org/age-active-life-clothing/ date accessed 24 November 2020
CDP Water Apparel Report September 2020, INTERWOVEN RISKS,UNTAPPED OPPORTUNITIES The business case for tackling water pollution in apparel and textile value chains – CDP, retrieved from https://www.cdp.net/en/research/global-reports/interwoven-risks-untapped-opportunities, date accessed 11 december 2020
Global challenges, cotton, https://www.theworldcounts.com/challenges/consumption/clothing/world-cotton-production-statistics/story, date accessed 11 december 2020
Assessment of Fertilizer Use by Crop at the Global Level, International Fertilizer Association (IFA) and International Plant Nutrition Institute (IPNI) 2014-2014/15, November 2017 and 2006/2007 – 2007/2008, April 2009.
The water footprint of cotton consumption: An assessment of the impact of worldwide consumption of cotton products on the water resources in the cotton producing countries, A.Y. Hoekstra et. al., Ecological Economics 60, 2006.
World Water Day: the cost of cotton in water-challenged India, Stephen Leahy, The Guardian, 20 March 2015.


